Counting isopods#
For a more detailed description see: https://www.phenopype.org/gallery/projects/isopod-counting/
import phenopype as pp
import os

## my root directory - modify as you see fit
os.chdir(r"D:\science\packages\phenopype\phenopype-gallery_exec")

## my laptop has a small screen, so I use a smaller phenopype window
pp._config.window_max_dim = 800
Make phenopype project#
Create a phenopype project (remember, Project is used to both create new projects, and load existing ones). Different phenopype projects can be useful, e.g., to process different batches of images from field seasons, perspectives, etc,. It makes sense to create them side by side in a subfolder, which I call “phenopype”. Thus, my research projects often have the following directory structure (just my way of working - this is really totally up to you):
my-project
    data                       # processed data (e.g., tables)
    data_raw                   # raw data (images, videos, etc.)
    phenopype                  # phenopype projects
    phenopype_templates        # phenopype .yaml config templates
    scripts                    # python, R, etc.
    [...]                      # manuscripts, figures, literature, etc.
proj = pp.Project(r"phenopype\counting-isopods")
proj.add_files(image_dir = r"data_raw\isopod-counting")
proj.add_config(template_path=r"phenopype_templates\isopod-counting_template1.yaml", tag="v1")
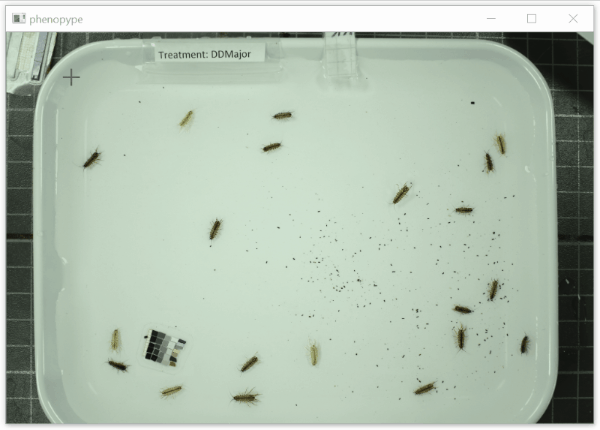
Add a project-wide size and color reference that will be detected in the images. Don’t forget to set the project-wide reference tag, which is useful in case your project uses multiple reference cards.#
proj.add_reference(reference_image_path=os.path.join(r"data_raw\isopod-counting","isopods1.jpg"), reference_tag="iso-scale")
Finally, loop through the images of the project with the Pype class. First, create a mask around all specimens, then edit any errors to the contours if necessary:
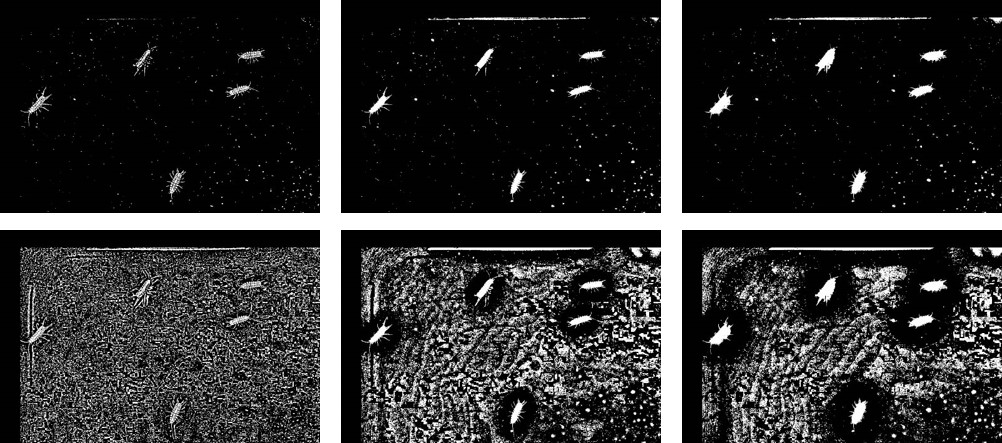
Some comments on the settings: changing blocksize and constant on the threshold algorithm has a great effect on the result. This becomes evident when looking at the binarized image, which shows increasing blocksizes. You can inspect the binary images yourself by selecting canvas: mod in - select_canvas.
for path in proj.dir_paths:
    pp.Pype(path, tag="v1")
Once you’re done, collect the results
proj.collect_results(files=["canvas", "shape", "texture"], tag="v1", aggregate_csv=True, overwrite=True)